Category Archives: Maps
Paras

One of the maps in the topographic survey of Peru from the country’s national survey organization, Instituto Geogrรกfico Nacional. Contours are at 25m intervals and colouring/symbols indicate different types of terrain and vegetation. Some of the maps may contain small blank spaces representing as yet unmapped areas. Each sheet covers 30’ latitude by 30’ longitude.
Lima

One of the titles in a series of maps of the administrative departments of Peru, with topography shown by altitude colouring and spot heights. Most maps also indicate cultivated areas. Scales vary considerably, given different sizes of the departments. Railways and four different types of roads and dirt tracks are shown, as well as local
La Union

One of the maps in the topographic survey of Peru from the country’s national survey organization, Instituto Geogrรกfico Nacional. Contours are at 25m intervals and colouring/symbols indicate different types of terrain and vegetation. Some of the maps may contain small blank spaces representing as yet unmapped areas. Each sheet covers 30’ latitude by 30’ longitude.
Arequipa

One of the titles in a series of maps of the administrative departments of Peru, with topography shown by altitude colouring and spot heights. Most maps also indicate cultivated areas. Scales vary considerably, given different sizes of the departments. Railways and four different types of roads and dirt tracks are shown, as well as local
Recuay

One of the maps in the topographic survey of Peru from the country’s national survey organization, Instituto Geogrรกfico Nacional. Contours are at 25m intervals and colouring/symbols indicate different types of terrain and vegetation. Some of the maps may contain small blank spaces representing as yet unmapped areas. Each sheet covers 30’ latitude by 30’ longitude.
Corongo

One of the maps in the topographic survey of Peru from the country’s national survey organization, Instituto Geogrรกfico Nacional. Contours are at 25m intervals and colouring/symbols indicate different types of terrain and vegetation. Some of the maps may contain small blank spaces representing as yet unmapped areas. Each sheet covers 30’ latitude by 30’ longitude.
Huari

One of the maps in the topographic survey of Peru from the country’s national survey organization, Instituto Geogrรกfico Nacional. Contours are at 25m intervals and colouring/symbols indicate different types of terrain and vegetation. Some of the maps may contain small blank spaces representing as yet unmapped areas. Each sheet covers 30’ latitude by 30’ longitude.
Chivay

One of the maps in the topographic survey of Peru from the country’s national survey organization, Instituto Geogrรกfico Nacional. Contours are at 25m intervals and colouring/symbols indicate different types of terrain and vegetation. Some of the maps may contain small blank spaces representing as yet unmapped areas. Each sheet covers 30’ latitude by 30’ longitude.
Ouagadougou IGN Map

One of the titles in a series of topographic maps covering much of north-west Africa, produced as part of the IMW* project in 1960’s. Each map covers an area spanning 6ยฐ in longitude and 4ยฐ in latitude. There is some variation in colouring and the depiction of terrain, but hill-shading, spot heights and contours are
Monmouthshire
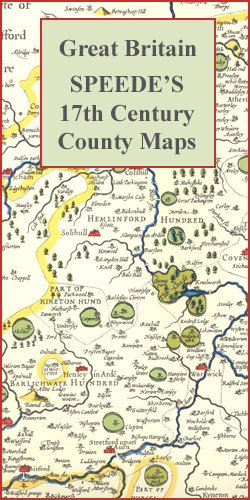
Monmouthshire in a series of colourful reproductions of attractive county maps by John Speede from about 1610-1611, printed on thick art paper and ideal for framing. Each title, 58 x 45cm / approx. 23″ x 18″, is decorated with additional notes, drawings, coats of arms, street plans, etc.Little drawings are used to show locations of
Ouesso IGN Map

One of the titles in a series of topographic maps covering much of north-west Africa, produced as part of the IMW* project in 1960’s. Each map covers an area spanning 6ยฐ in longitude and 4ยฐ in latitude. There is some variation in colouring and the depiction of terrain, but hill-shading, spot heights and contours are
Rutland

Rutland in a series of colourful reproductions of attractive county maps by John Speede from about 1610-1611, printed on thick art paper and ideal for framing. Each title, 58 x 45cm / approx. 23″ x 18″, is decorated with additional notes, drawings, coats of arms, street plans, etc.Little drawings are used to show locations of
Grand Panorama of London from the Thames
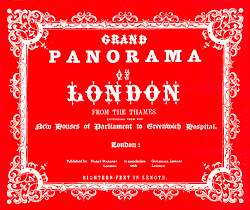
The Grand Panorama of London from the Thames presents an eighteen foot long continuous view of the river eastwards from the Houses of Parliament to the Isle of Dogs and westwards back to Deptford. Originally published in 1849, this beautifully reproduced panoramic print takes you on scenic journey up the river Thames as it looked
Worcestershire

Worcestershire in a series of colourful reproductions of attractive county maps by John Speede from about 1610-1611, printed on thick art paper and ideal for framing. Each title, 58 x 45cm / approx. 23″ x 18″, is decorated with additional notes, drawings, coats of arms, street plans, etc.Little drawings are used to show locations of
Mount McKinley
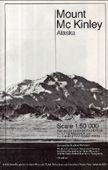
Folded map with excellent topographical relief shown with a vertical contour interval at 100ft. Spot heights are given for major peaks. Natural features & vegetation shown. No roads or habitation on area of map. Because of the amount of snow/ice the general colours of the map are shades of a pleasing light-blue. Nice to look
Balloon View of London
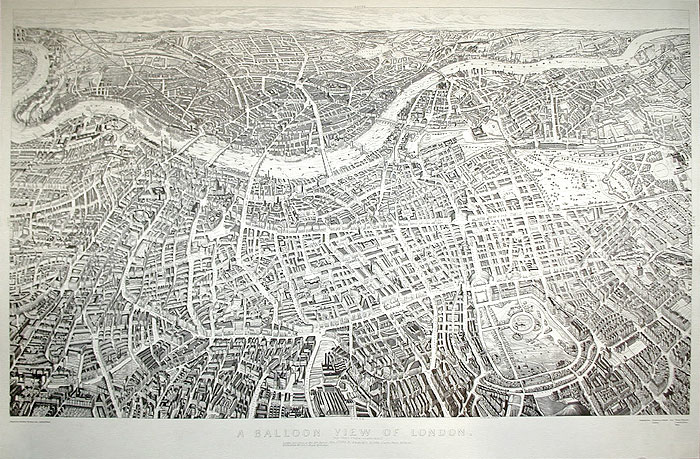
One of several maps and panoramas of London to come out in 1851, the year of the Great Exhibition. This is an aerial panorama, naming streets and showing many individual buildings. The view is looking southwards and therefore appears “upside-down” compared to most maps. The enormous glass building built in Hyde Park for the Great
Spitsbergen South
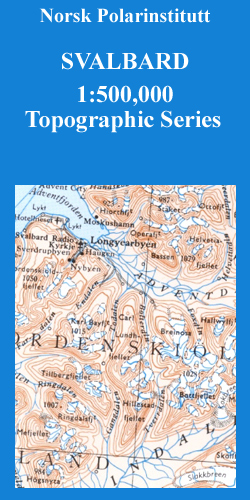
One of the titles in a series of topographic maps with contours at 100m intervals. Physical features shown include moraine, rocks, coastline with flat foreshore, etc. The maps also show settlements, roads, mines, cabins, radio stations, aerial cableways, airfields, etc. National park and nature reserve boundaries are marked. The maps have a UTM grid and
Edgeรธya

One of the titles in a series of topographic maps with contours at 100m intervals. Physical features shown include moraine, rocks, coastline with flat foreshore, etc. The maps also show settlements, roads, mines, cabins, radio stations, aerial cableways, airfields, etc. National park and nature reserve boundaries are marked. The maps have a UTM grid and
Spitsbergen North

One of the titles in a series of topographic maps with contours at 100m intervals. Physical features shown include moraine, rocks, coastline with flat foreshore, etc. The maps also show settlements, roads, mines, cabins, radio stations, aerial cableways, airfields, etc. National park and nature reserve boundaries are marked. The maps have a UTM grid and


