Category Archives: Maps
Midvagur
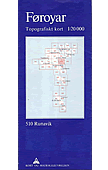
Topographic survey of Faroe Islands at 1:20,000 prepared by the Danish national mapping agency Kort og Matrikelstyrelsen. The islands’ topography is vividly presented by contours at 5 metre intervals, enhanced by relief shading plus colouring and/or graphics for different types of terrain or vegetation (scree, boulders, etc). The maps show all the detail expected of
Svinoy

Topographic survey of Faroe Islands at 1:20,000 prepared by the Danish national mapping agency Kort og Matrikelstyrelsen. The islands’ topography is vividly presented by contours at 5 metre intervals, enhanced by relief shading plus colouring and/or graphics for different types of terrain or vegetation (scree, boulders, etc). The maps show all the detail expected of
Famara

Topographic survey of Faroe Islands at 1:20,000 prepared by the Danish national mapping agency Kort og Matrikelstyrelsen. The islands’ topography is vividly presented by contours at 5 metre intervals, enhanced by relief shading plus colouring and/or graphics for different types of terrain or vegetation (scree, boulders, etc). The maps show all the detail expected of
Famjin

Topographic survey of Faroe Islands at 1:20,000 prepared by the Danish national mapping agency Kort og Matrikelstyrelsen. The islands’ topography is vividly presented by contours at 5 metre intervals, enhanced by relief shading plus colouring and/or graphics for different types of terrain or vegetation (scree, boulders, etc). The maps show all the detail expected of
Hvalba

Topographic survey of Faroe Islands at 1:20,000 prepared by the Danish national mapping agency Kort og Matrikelstyrelsen. The islands’ topography is vividly presented by contours at 5 metre intervals, enhanced by relief shading plus colouring and/or graphics for different types of terrain or vegetation (scree, boulders, etc). The maps show all the detail expected of
Sandur

Topographic survey of Faroe Islands at 1:20,000 prepared by the Danish national mapping agency Kort og Matrikelstyrelsen. The islands’ topography is vividly presented by contours at 5 metre intervals, enhanced by relief shading plus colouring and/or graphics for different types of terrain or vegetation (scree, boulders, etc). The maps show all the detail expected of
Skopun

Topographic survey of Faroe Islands at 1:20,000 prepared by the Danish national mapping agency Kort og Matrikelstyrelsen. The islands’ topography is vividly presented by contours at 5 metre intervals, enhanced by relief shading plus colouring and/or graphics for different types of terrain or vegetation (scree, boulders, etc). The maps show all the detail expected of
Gjogv

Topographic survey of Faroe Islands at 1:20,000 prepared by the Danish national mapping agency Kort og Matrikelstyrelsen. The islands’ topography is vividly presented by contours at 5 metre intervals, enhanced by relief shading plus colouring and/or graphics for different types of terrain or vegetation (scree, boulders, etc). The maps show all the detail expected of
Sumba

Topographic survey of Faroe Islands at 1:20,000 prepared by the Danish national mapping agency Kort og Matrikelstyrelsen. The islands’ topography is vividly presented by contours at 5 metre intervals, enhanced by relief shading plus colouring and/or graphics for different types of terrain or vegetation (scree, boulders, etc). The maps show all the detail expected of
Vagur

Topographic survey of Faroe Islands at 1:20,000 prepared by the Danish national mapping agency Kort og Matrikelstyrelsen. The islands’ topography is vividly presented by contours at 5 metre intervals, enhanced by relief shading plus colouring and/or graphics for different types of terrain or vegetation (scree, boulders, etc). The maps show all the detail expected of
Tvoroyri

Topographic survey of Faroe Islands at 1:20,000 prepared by the Danish national mapping agency Kort og Matrikelstyrelsen. The islands’ topography is vividly presented by contours at 5 metre intervals, enhanced by relief shading plus colouring and/or graphics for different types of terrain or vegetation (scree, boulders, etc). The maps show all the detail expected of
Litla Dimun

Topographic survey of Faroe Islands at 1:20,000 prepared by the Danish national mapping agency Kort og Matrikelstyrelsen. The islands’ topography is vividly presented by contours at 5 metre intervals, enhanced by relief shading plus colouring and/or graphics for different types of terrain or vegetation (scree, boulders, etc). The maps show all the detail expected of
Stora Dimun

Topographic survey of Faroe Islands at 1:20,000 prepared by the Danish national mapping agency Kort og Matrikelstyrelsen. The islands’ topography is vividly presented by contours at 5 metre intervals, enhanced by relief shading plus colouring and/or graphics for different types of terrain or vegetation (scree, boulders, etc). The maps show all the detail expected of
San Felipe
Topographic mapping from Mexico’s national survey agency, Instituto Nacional de Estadรญstica, Geografรญa e Informรกtica. The maps have contours at 20m intervals with relief shading and indicate various types of terrain and vegetation, e.g. dense vegetation, cultivated areas, swamps, sand dunes, salt pans, etc. UTM grid is at 10km intervals, with latitude and longitude shown by
Veracruz

Topographic mapping from Mexico’s national survey agency, Instituto Nacional de Estadรญstica, Geografรญa e Informรกtica. The maps have contours at 20m intervals with relief shading and indicate various types of terrain and vegetation, e.g. dense vegetation, cultivated areas, swamps, sand dunes, salt pans, etc. UTM grid is at 10km intervals, with latitude and longitude shown by
San Isidro

Topographic mapping from Mexico’s national survey agency, Instituto Nacional de Estadรญstica, Geografรญa e Informรกtica. The maps have contours at 20m intervals with relief shading and indicate various types of terrain and vegetation, e.g. dense vegetation, cultivated areas, swamps, sand dunes, salt pans, etc. UTM grid is at 10km intervals, with latitude and longitude shown by
Villahermosa

Topographic mapping from Mexico’s national survey agency, Instituto Nacional de Estadรญstica, Geografรญa e Informรกtica. The maps have contours at 20m intervals with relief shading and indicate various types of terrain and vegetation, e.g. dense vegetation, cultivated areas, swamps, sand dunes, salt pans, etc. UTM grid is at 10km intervals, with latitude and longitude shown by
San Jose del Cabo

Topographic mapping from Mexico’s national survey agency, Instituto Nacional de Estadรญstica, Geografรญa e Informรกtica. The maps have contours at 20m intervals with relief shading and indicate various types of terrain and vegetation, e.g. dense vegetation, cultivated areas, swamps, sand dunes, salt pans, etc. UTM grid is at 10km intervals, with latitude and longitude shown by
San Miguel

Topographic mapping from Mexico’s national survey agency, Instituto Nacional de Estadรญstica, Geografรญa e Informรกtica. The maps have contours at 20m intervals with relief shading and indicate various types of terrain and vegetation, e.g. dense vegetation, cultivated areas, swamps, sand dunes, salt pans, etc. UTM grid is at 10km intervals, with latitude and longitude shown by
Santa Rosalia

Topographic mapping from Mexico’s national survey agency, Instituto Nacional de Estadรญstica, Geografรญa e Informรกtica. The maps have contours at 20m intervals with relief shading and indicate various types of terrain and vegetation, e.g. dense vegetation, cultivated areas, swamps, sand dunes, salt pans, etc. UTM grid is at 10km intervals, with latitude and longitude shown by


